From the Archives: Mapping in the '70s
From the Archives: Mapping in the '70s
Mapping in the 1970s
In the late 1970s, maps were primarily printed on paper and definitely didn’t have the ability to point you toward any nearby restaurants or tell you what traffic conditions to expect on the drive home.
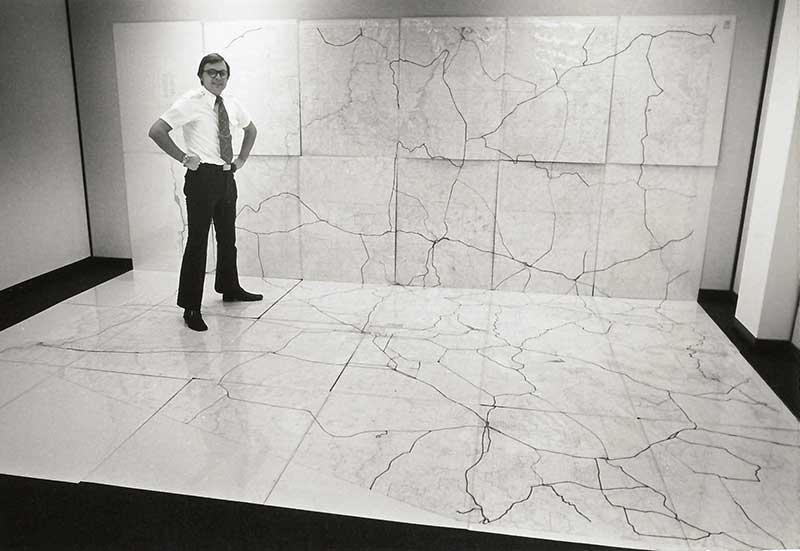
Back then, work to develop the earliest Geographic Information Systems (GIS) was well underway, but as evidenced by this 1977 photograph, the technology wasn’t widely in use yet.
Taken for an issue of Newsbeat (ADOT’s employee newsletter of the day), the photo shows Travel and Facilities Section Manager James Pfalzer standing on top of a 15-by-17-foot map devised to help planners evaluate Arizona traffic statistics.
According to the accompanying Newsbeat article, the low-tech map was made by piecing together multiple sections of a state atlas. Each of the 30 charts displayed a 400-square-mile area. They were also covered with clear acetate and marked up to identify state highways. Pfalzer is quoted in the story describing the large map’s purpose and explaining how the information obtained from studying the map would later be coded into a computer to log statewide traffic volume statistics.
“We needed a map that we could lay out as one continuous chart to show small stretches of roadway in great detail,” Pfalzer said. “Our people are evaluating some 600 locations where we may perform our annual 24-hour traffic counts. These maps detail areas of the state where we can expect traffic patterns to change.”
It’s safe to say modern mapping technology has come a long way in the last 40 years.
Advances in the GIS field have expanded the usefulness of maps and changed the way ADOT is able to manage and analyze information. GIS stores data and gives users the ability to present it onto different layers of a map. It’s especially useful when comparing and analyzing different sets of information, whether someone is looking for the closest shopping center or prioritizing state transportation projects.
Current-day Data Analytics Section Manager James Meyer said that through its use of GIS, ADOT is able to get much more value from its data.
ADOT uses the tech to create maps of the state’s highway system that display everything from traffic volume and demographic data to pavement quality and capacity. The agency also works in partnership with other agencies, sharing data back and forth with the State Land Department and other state offices.
“Mapping is only 10 to 15 percent of what we do with GIS at ADOT,” Meyer said. “GIS is a way of informing people about what’s going on geospatially. Most of our work is spent keeping that information up to date … we’re more data scientists than cartographers.”
While some might take maps for granted, Meyer says he hopes that people realize the value of all that data behind those maps and products they use every day.
“Sometimes it’s hard to see problems in the data if you don’t see it on a map,” Meyer said. For a look at some of ADOT’s modern maps, check the ADOT website.
It’s safe to say things have changed since 1912 when the Arizona Highway Department was first established. But you don’t just have to take our word … we’ve got plenty of pictures to prove it. We combed through our archives and decided to periodically post these photos from the past in a blog series we’re calling, “From the ADOT Archives.